Solar Radiation, Heat Balance and Temperature
1. Multiple choice questions.
(i) The sun is directly overhead at noon on 21st June at:
(a) The equator (c) 23.5° N
(b) 23.5° S (d) 66.5° N
Answer:
(ii) In which one of the following cities, are the days the longest?
(a) Tiruvanantpuram (c) Hyderabad
(b) Chandigarh (d) Nagpur
Answer:
(iii) The atmosphere is mainly heated by the:
(a) Short wave solar radiation (c) Long wave terrestrial radiation
(b) Reflected solar radiation (d) Scattered solar radiation
Answer:
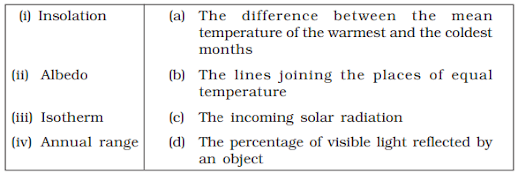
(iv) Make correct pairs from the following two columns.

Answer:
v) The main reason that the earth experiences highest temperatures in the subtropics in the northern hemisphere rather than at the equator is :
(a) Subtropical areas tend to have less cloud cover than equatorial areas.
(b) Subtropical areas have longer day hours in the summer than the quatorial.
(c) Subtropical areas have an enhanced “green house effect” compared to equatorial areas.
(d) Subtropical areas are nearer to the oceanic areas than the equatorial locations.
Answer:
2. Answer the following questions in about 30 words.
(i) How does the unequal distribution of heat over the planet earth in space and time cause variations in weather and climate?
Answer:
(ii) What are the factors that control temperature distribution on the surface of the earth?
Answer:
(iii) In India, why is the day temperature maximum in May and why not after the summer solstice?
Answer:
(iv) Why is the annual range of temperature high in the Siberian plains?
Answer:
3. Answer the following questions in about 150 words.
(i) How do the latitude and the tilt in the axis of rotation of the earth affect the amount of radiation received at the earth’s surface?
Answer:
(ii) Discuss the processes through which the earth-atmosphere system maintains heat balance.
Answer:
(iii) Compare the global distribution of temperature in January over the northern and the southern hemisphere of the earth.
Project Work
Select a meteorological observatory located in your city or near your town. Tabulate the temperature data as given in the climatological table of observatories :
(i) Note the altitude, latitude of the observatory and the period for which the mean is calculated.
(ii) Define the terms related to temperature as given in the table.
(iii) Calculate the daily mean monthly temperature.
(iv) Draw a graph to show the daily mean maximum, the daily mean minimum and the mean temperature.
(v) Calculate the annual range of temperature.
(vi) Find out in which months the daily range of temperature is the highest and the lowest.
(vii) List out the factors that determine the temperature of the place and explain the possible causes for temperature variation in the months of January, May, July and October.
Example
Observatory : New Delhi (Safdarjung)
Latitude : 28°35°’ N
Based on observations : 1951 – 1980
Altitude above mean sea level : 216 m